
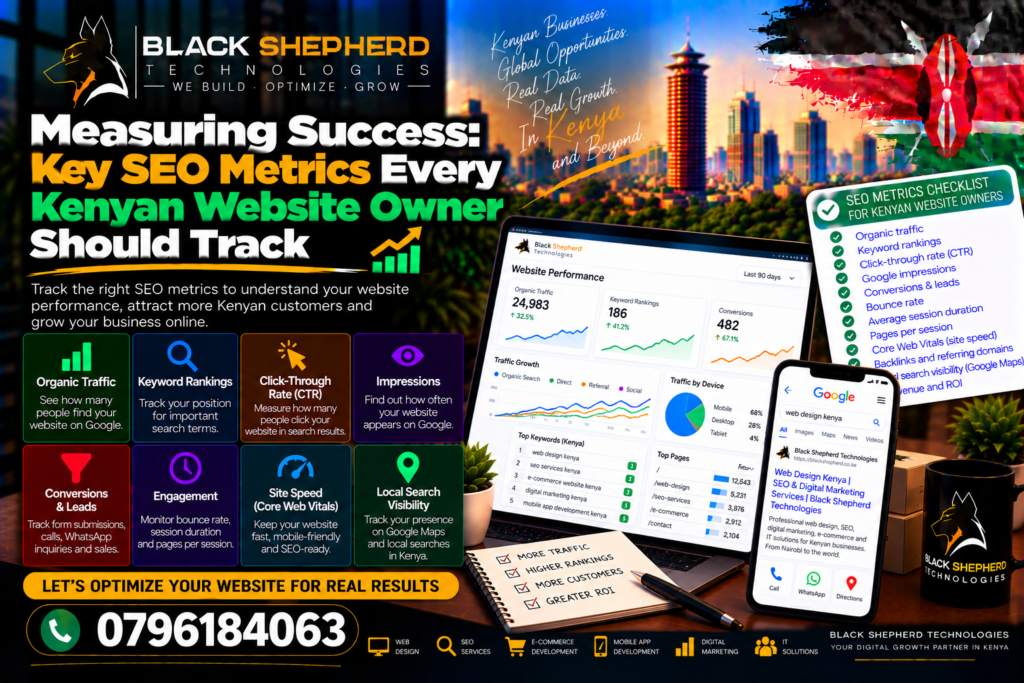
In Kenya’s vibrant and fast-evolving digital economy, investing in Search Engine Optimization (SEO) is a powerful commitment to long-term business growth. Whether you manage an e-commerce platform in Nairobi’s Westlands, a corporate law firm in Upper Hill, or a hospitality enterprise along the coast in Diani, driving organic traffic to your website is only half the battle.
The true test of an effective digital strategy lies in how you measure success. Many business owners make the mistake of tracking vanity metrics—such as arbitrary keyword rankings or total raw visits—without connecting those numbers to actual business revenue. If your analytics show rising traffic but your phone lines remain quiet and your inquiry forms stay empty, your measurement framework needs a radical alignment.
In this comprehensive guide, we will explore the essential SEO metrics every Kenyan website owner should track, how to separate meaningful performance indicators from noise, and how data-driven insights translate directly into commercial return on investment.
1. Moving Beyond Vanity Metrics: The Shift to Business Value
In the early days of digital marketing, success was often judged by whether a website appeared at position number one for a specific broad keyword. While ranking high feels satisfying, algorithms are personalized, location-sensitive, and constantly fluctuating.
A high ranking for a generic term like “best software” might bring thousands of unqualified clicks from people looking for free downloads rather than enterprise solutions. True SEO success focuses on qualified traffic, user engagement, and conversion revenue. You must measure how well your organic search visibility attracts the right audience—people in your target market who are ready to make a purchasing decision.
To build a robust measurement framework, partnering with experts who utilize comprehensive tracking models via professional SEO Services Kenya ensures that your analytics connect directly to bottom-line business growth.
2. Core Traffic and Visibility Metrics (Google Search Console)
Your first window into SEO performance is Google Search Console (GSC). GSC provides unfiltered data directly from search engine crawlers regarding how your website appears in search results across Kenya.
A. Total Impressions and Clicks
-
Impressions: How many times a link to your website appeared on a search engine results page (SERP) for a user’s query. High impressions with low clicks indicate that your meta titles and descriptions need refinement to be more compelling.
-
Clicks: The actual number of times users clicked your link to visit your site. Tracking upward trends in monthly organic clicks confirms that your visibility and relevance are growing.
B. Average Click-Through Rate (CTR)
CTR is the percentage of impressions that result in a click (Clicks divided by Impressions). A low CTR means your search snippets are not convincing enough compared to competitors. Optimizing your title tags and meta descriptions with compelling, localized language directly improves your CTR.
C. Average Keyword Position
While keyword positions fluctuate, tracking the movement of your core commercial keywords (e.g., “commercial interior designers Nairobi” or “hardware supplier Mombasa Road”) helps you gauge whether your SEO authority is climbing over a 3-to-6-month window.
3. Engagement and User Experience Metrics (Google Analytics 4)
Once users land on your website, what do they do? Google Analytics 4 (GA4) tracks user behavior, helping you determine whether your website design and content satisfy search intent.
A. Engaged Sessions and Dwell Time
-
Engagement Rate: The percentage of sessions that lasted longer than 10 seconds, had 2 or more page views, or resulted in a conversion event. This is a far more reliable indicator of audience quality than the traditional bounce rate.
-
Dwell Time: How long a user stays on your page before returning to search results. Long dwell times signal to search algorithms that your content is valuable, informative, and engaging.
B. Core Web Vitals Performance
Search engines directly factor technical user experience into ranking algorithms. Tracking your performance on metrics like Largest Contentful Paint (LCP) for loading speed and Cumulative Layout Shift (CLS) for visual stability ensures your site delivers a seamless experience on mobile data networks across Kenya.
4. Conversion and Revenue Metrics (The Bottom Line)
Traffic without conversions is an empty metric. To calculate your true digital return on investment, you must track actions that drive revenue.
Key Conversion Events to Track:
-
Inbound Form Submissions: Contact page inquiries, quotation requests, and consultation bookings.
-
Phone Call Clicks: Tracking taps on clickable
tel:phone numbers embedded in your website header or footer. -
WhatsApp Chat Initiations: Measuring how many users tap floating WhatsApp chat buttons to start conversations with your sales team.
-
Completed E-Commerce Checkouts: Tracking successful orders, completed M-Pesa transactions, and total revenue generated specifically from organic search channels.
To examine how high-converting layouts, robust catalog structures, and custom digital architectures are successfully deployed across complex commercial projects, exploring verified case studies via Portfolios and Projects offers clear visual and structural insights.
5. Local SEO and Map Pack Metrics
For businesses operating physical storefronts, offices, or service areas in specific regions across Kenya, tracking local search visibility is paramount.
Key Local Metrics:
-
Google Business Profile (GBP) Views: How many times your business profile appeared on Google Maps and local search results.
-
Direction Requests: How many users clicked “Get Directions” to navigate to your physical office or retail shop.
-
GBP Phone Calls: Direct inquiries initiated from your Google Business Profile listing.
-
Review Velocity and Sentiment: Tracking the volume and average star rating of customer reviews on your profile, which heavily influences local map pack rankings.
6. Sector-Specific Tracking Frameworks
Different industries require customized key performance indicators (KPIs) to measure SEO success accurately.
| Industry Sector | Primary Tracking Focus | Key Performance Indicators (KPIs) |
| E-Commerce & Retail | Catalog traffic, transaction value, cart completion rate. | Organic revenue, average order value, product page conversions, checkout drop-off rate. |
| B2B & Professional Services | Lead generation, form quality, consultation bookings. | Inbound form submissions, phone call clicks, gated content downloads, cost per lead. |
| Hospitality & Tourism | Destination search queries, direct booking engine traffic. | Room reservation inquiries, seasonal traffic spikes, mobile booking completion rates. |
To explore how specialized performance frameworks are tailored to diverse commercial landscapes and unique business models, you can examine our customized frameworks via Industries We Serve.
7. A Step-by-Step Blueprint to Set Up Your SEO Dashboard
Follow this practical roadmap to build an actionable SEO measurement dashboard for your business:
Step 1: Verify and Link Analytics Tools
Ensure Google Search Console and Google Analytics 4 are properly installed and linked to your website domain. Configure conversion events (such as form submissions and button taps) inside GA4.
Step 2: Establish Your Baseline Metrics
Document your current monthly organic traffic, average keyword positions, conversion rates, and total organic revenue before launching new SEO campaigns.
Step 3: Create a Monthly Reporting Cadence
Avoid staring at daily fluctuations, as search algorithms shift constantly. Review monthly trends in keyword growth, organic traffic expansion, and inbound lead volume.
Step 4: Continuously Refine and Iterate
Use your data insights to identify underperforming pages, optimize high-potential keywords, and improve user experience bottlenecks to compound your digital returns over time.
Conclusion
Measuring SEO success in Kenya requires looking far beyond vanity metrics and keyword rankings. By tracking a balanced combination of visibility signals in Google Search Console, user engagement data in Google Analytics 4, local map pack performance, and bottom-line conversion revenue, you gain a crystal-clear picture of your digital ROI.
Audit your analytics setup today, focus on metrics that drive actual business growth, and position your brand for sustainable,data-backed success in Kenya’s competitive digital economy.